Blog
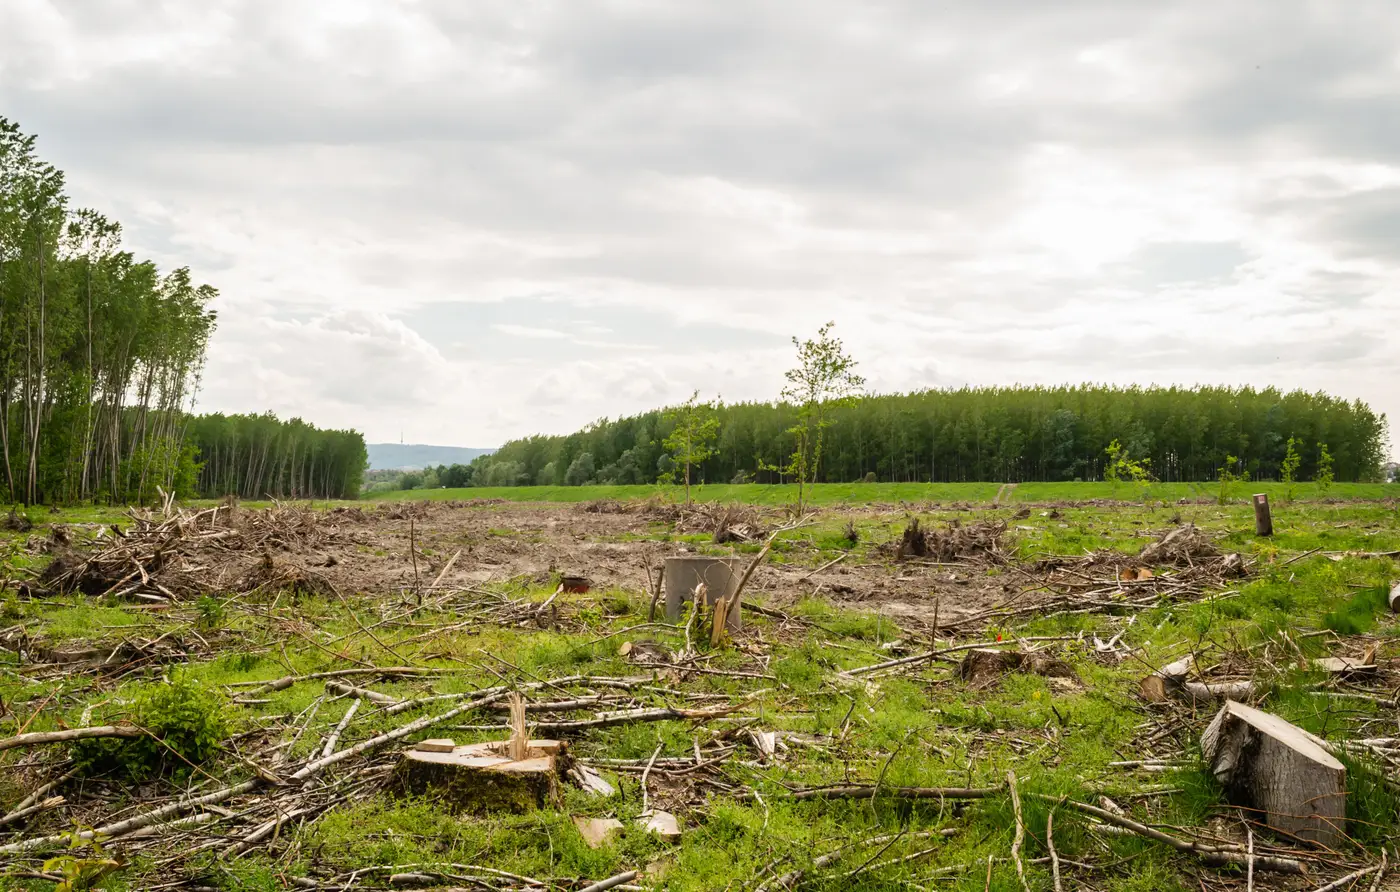 Field notes: the morning the minister asked why last year's number changed
A statistics analyst's field notes on the moment a revised land-cover figure landed on the minister's desk, and what it revealed.
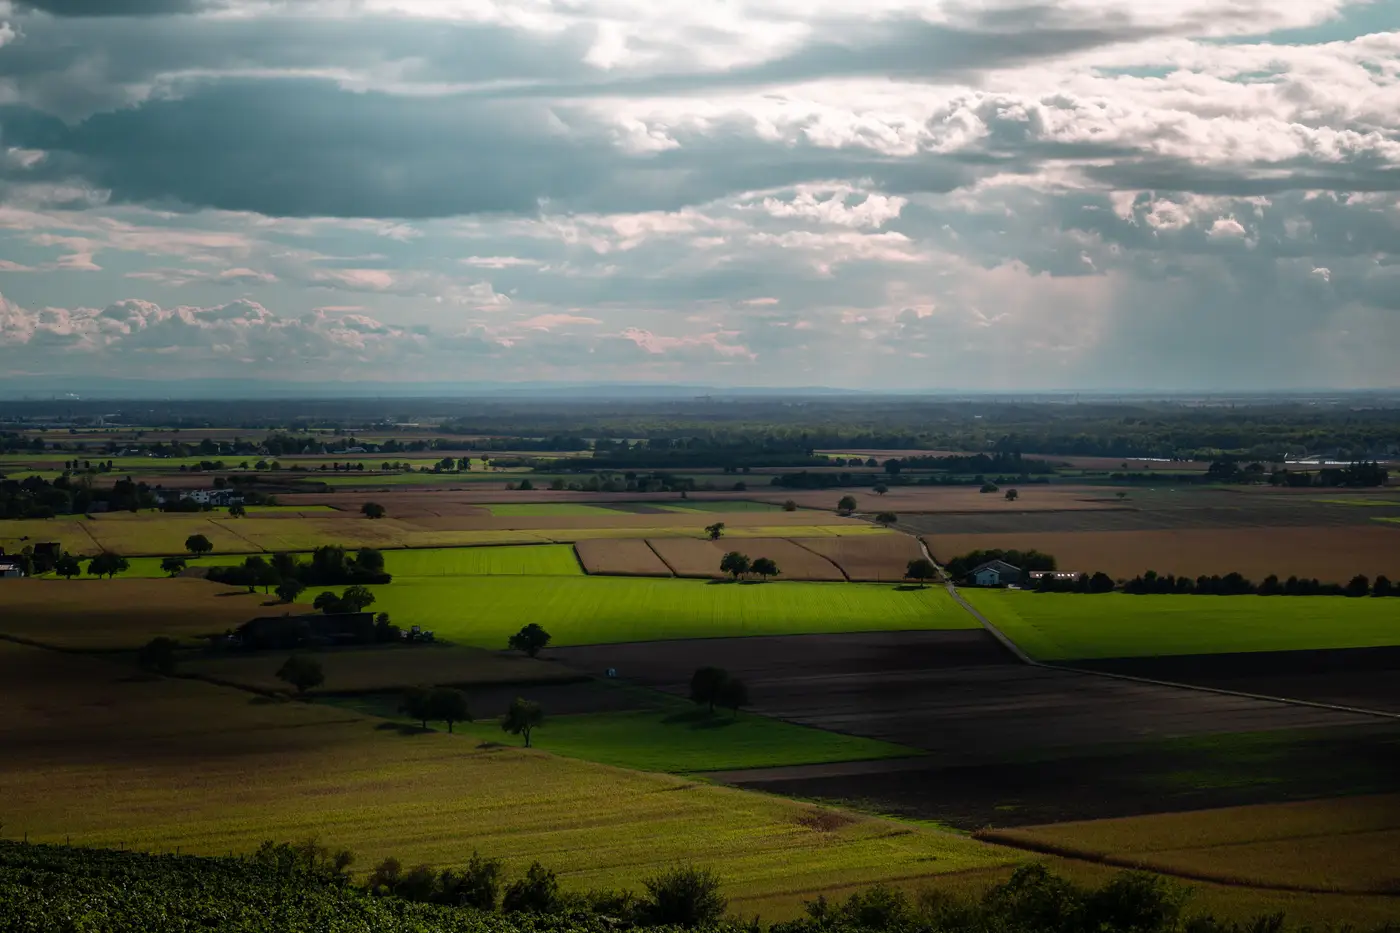 What is a revision policy, and why your land-cover figure needs one
Why national land-cover change statistics need a revision policy, and how backcasting keeps a multi-decade time series defensible under review.
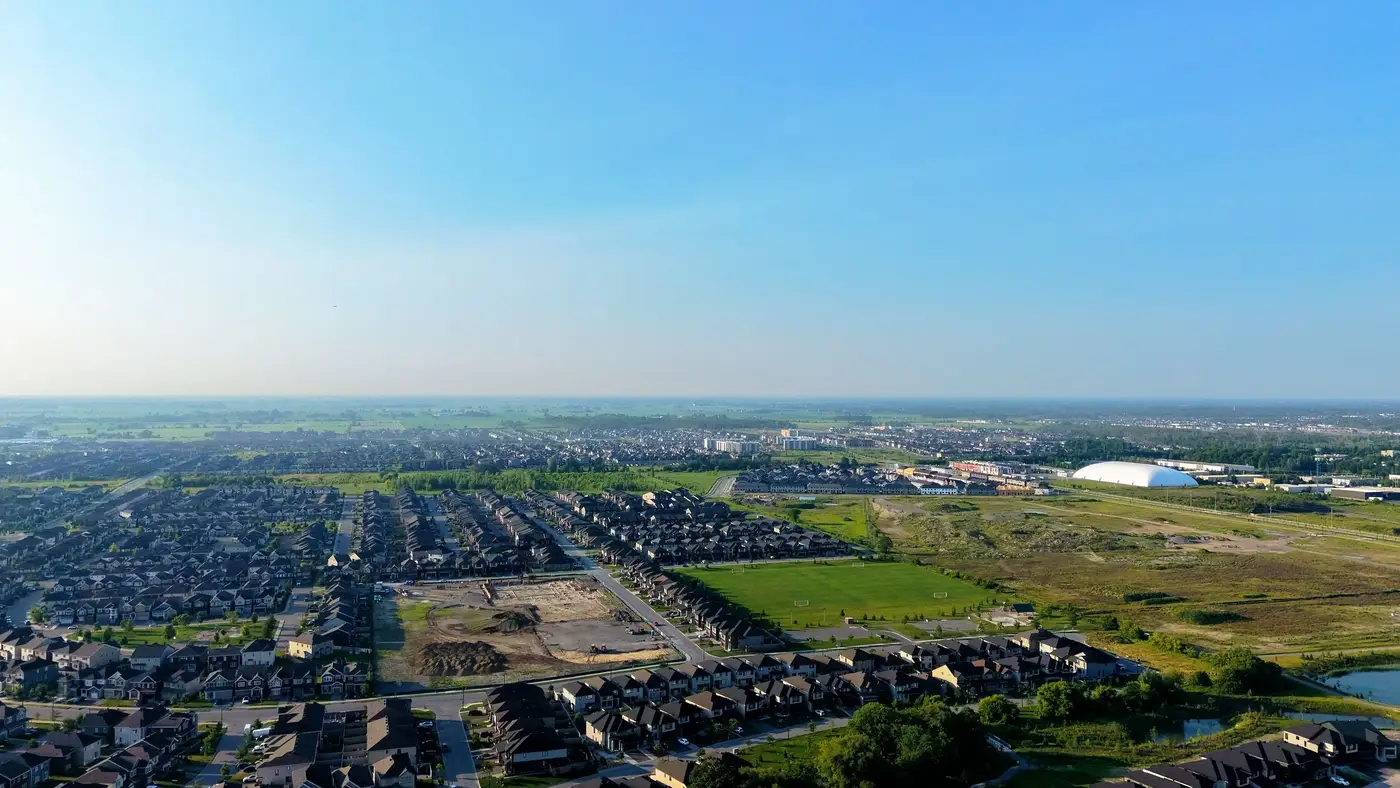 Attributing land-cover change to its drivers for an SDG report
How to split national land-cover change into agriculture, urban and other drivers for SDG and LDN reporting, without the base layer shifting each cycle.
 What is SDG indicator 6.6.1, and how land-cover data backs a water-ecosystem report
SDG indicator 6.6.1 tracks change in water-related ecosystem extent. What the land-cover data behind that figure needs to hold up.
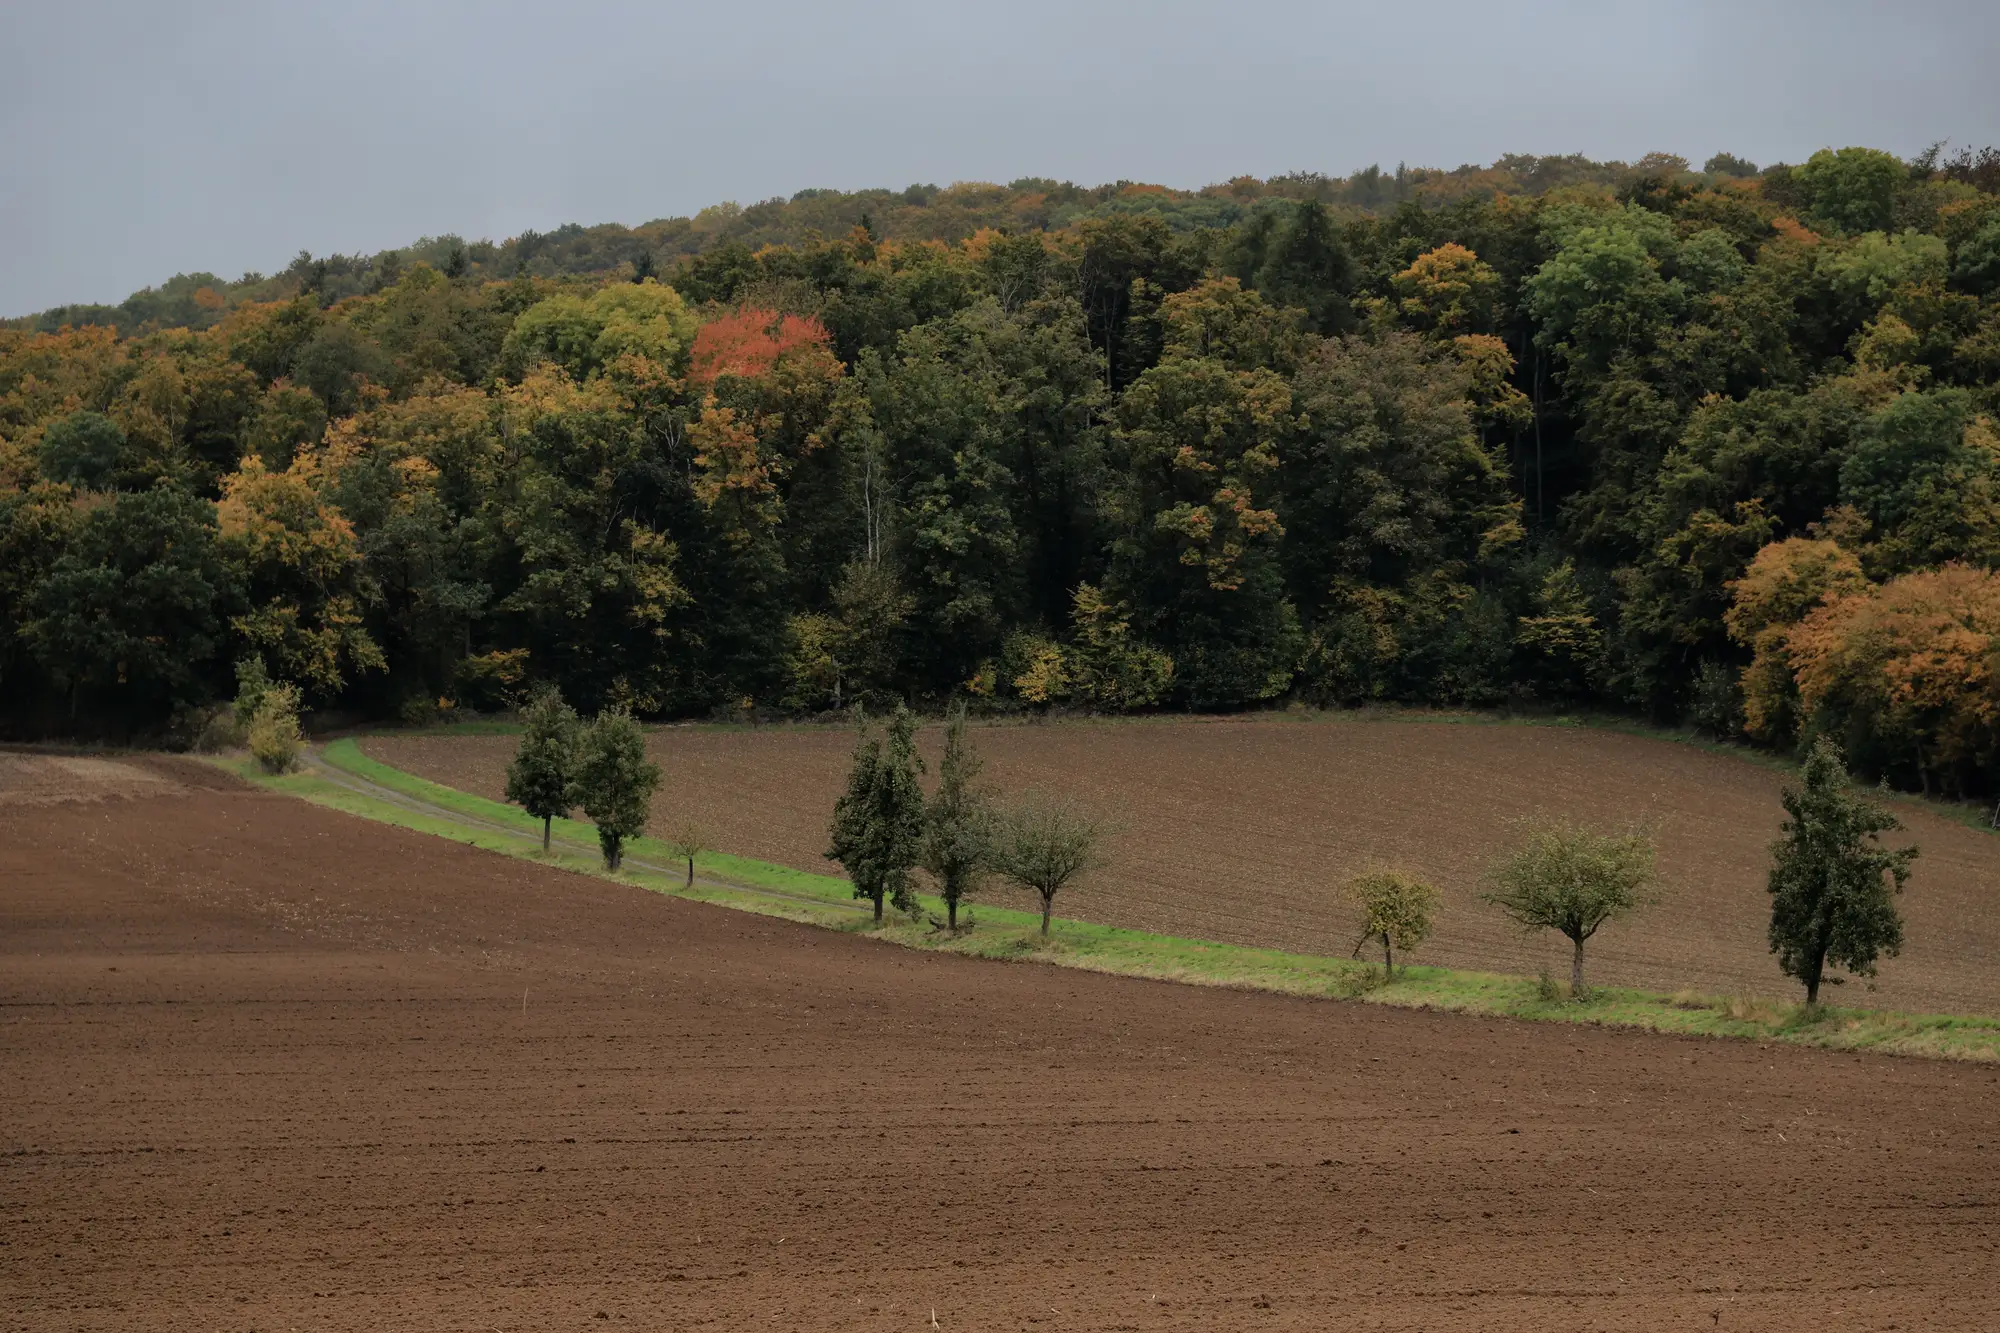 Field notes: the first annual refresh after the satellite programme changed its sensor
A field-notes account of what happens to national land-cover change figures the year a satellite programme's sensor changes, and how to catch the artefact.
- Calculating net forest cover change for SDG 15.1.1: a working method
How to calculate net forest cover change and forest area as a proportion of total land area for SDG 15.1.1 reporting, and why the number slips between cycles.
- How to apply the Olofsson method for land-cover change area estimation
A working walkthrough of stratified sampling, the error matrix, and the unbiased area estimator from Olofsson et al.'s good practice guidance.
- SDG indicator 11.3.1: what LCRPGR needs from your land-cover data
SDG indicator 11.3.1 explained: what LCRPGR measures and the land-cover data a national statistics team needs to report it.
- Field notes: the year two provinces read the same imagery and reported opposite trends
Two provinces read the same satellite mosaic and reported opposite deforestation trends because of how each compiled it.
- How to build a land-cover transition matrix for a national report
A step-by-step walkthrough for building a class-to-class land-cover transition matrix for SDG and national land-cover change reporting.
- Reconciling sub-national land-cover change figures into one national total
A rollup method for aggregating provincial land-cover change statistics into a national figure that survives audit, for SDG and UNFCCC reporting.
 What is a land-cover transition matrix? A guide for statistics offices
A plain explanation of land-cover transition matrices and gain-loss accounting, and why national statistics offices build change figures this way.
- Reconciling national land cover figures with FAOSTAT land use data
A working method for reconciling national land cover figures with FAOSTAT land use data: why the gap exists and how to build a crosswalk that survives audit.
- FAO's LCCS explained: the land cover nomenclature behind SDG reporting
What the FAO Land Cover Classification System does, and why it keeps surfacing in SDG 15.3.1, 11.3.1 and 6.6.1 reporting.
- Harmonizing land-cover legends across reporting cycles
How to build a crosswalk table that reconciles land-cover class legends across reporting cycles for defensible SDG change figures.
- Post-classification comparison vs direct multidate classification
Post-classification comparison or direct multidate classification: which method survives audit for SDG land-cover change figures.
- What is a confusion matrix in land-cover accuracy assessment?
A plain explanation of the confusion matrix behind land-cover accuracy assessment, and what producer's, user's and overall accuracy tell you.
- What is land degradation neutrality under SDG indicator 15.3.1?
A breakdown of LDN's three sub-indicators under SDG 15.3.1, and why the land cover component is the one your reporting file can actually defend.