Field notes: the year two provinces read the same imagery and reported opposite trends
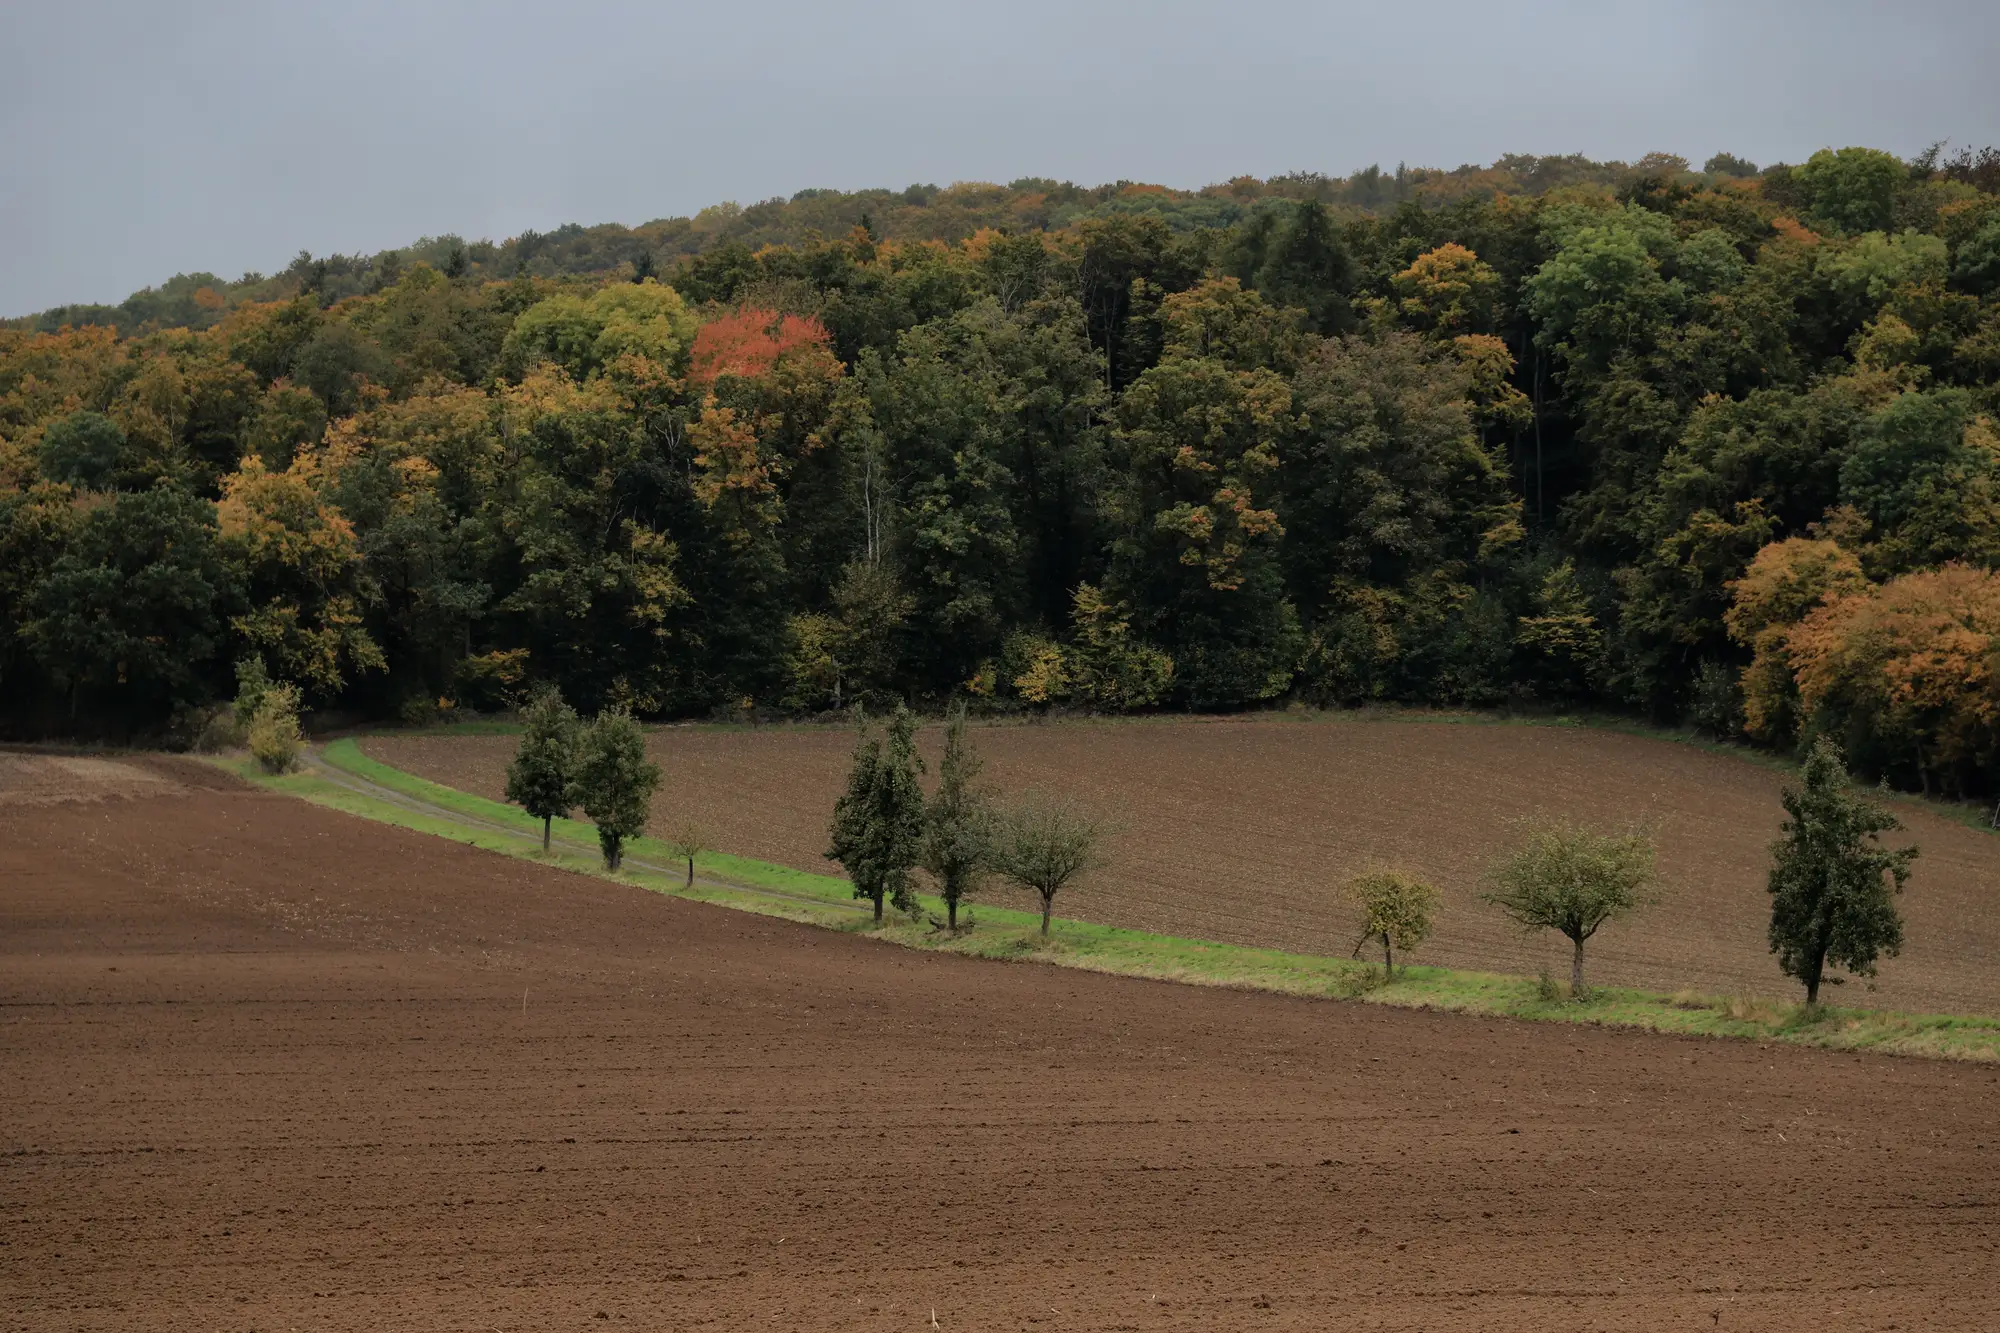
Two reports landed on my desk the same week last reporting cycle. Both built off the same national mosaic. Both covering forest area change for the SDG 15.1.1 submission. One province showed a net gain in forest cover against its 2015 baseline. The province next to it, sharing a watershed and in a few places a literal fence line, showed a loss big enough that someone had already flagged it red in the summary table before it reached me.
The programme behind both figures was identical: the same wide-swath platform, the same spectral bands, the same nominal pixel size everyone in this line of work has learned to live with. Two directions of travel that could not both be describing the same forest.
It took most of a week to find the real difference, and it wasn't glamorous. Province A's contractor had compiled their change layer from a dry-season composite, three months chosen partly because that's when the cloud mask cleared enough scenes to work with. Province B's team, working to a different internal deadline, had pulled from a composite that leaned wet-season, caught more haze-contaminated pixels in the classifier, and ended up calling a chunk of regenerating scrub "non-forest" that Province A's dry-season read had called "forest, degraded." Neither classification was wrong on its own terms. They were answering slightly different questions and reporting the answers as if they were the same question.
This is the part nobody puts in the methodology annex: the trend you report depends as much on when the composite was built and who built it as on what actually happened on the ground that year. A province that changes contractors between reporting cycles, or lets one unit commission a fresh classification study while the neighbouring unit reuses last cycle's pipeline with a tweak, will produce a seam at the provincial border that has nothing to do with land cover and everything to do with procurement history.
I've seen three variants of this same problem now, and they all trace back to the same root. A new classification gets commissioned for one reporting cycle but not refreshed for the next, so you're comparing a 2019 study to a 2024 study with different training data and different cloud-handling rules, and calling the delta between them "change." Two sub-national units contract separately, in different months, to different classifiers, and never reconcile the mosaics before stitching the national figure. Or a single national dataset exists but gets reclassified by hand province by province when the central file runs late, and every local analyst makes a slightly different call on what counts as degraded versus intact.
None of it shows up as an error, exactly. Every province's analyst was doing careful work with the dataset they had. The error is structural: the country doesn't have one annually-refreshed change layer running the same classification logic over the whole territory, so the comparison across the border is never really measuring the same thing twice, even when everyone involved believes it is.
The fix for that cycle was unglamorous too. Hold both provinces to the same compositing window and the same classifier version, rerun, and watch the "opposite trends" collapse into a single modest decline across both, which is what had happened all along. The watershed had lost forest. It just hadn't lost forest in the shape either original report described.
What stuck with me is how much of national SDG reporting rests on an assumption nobody states out loud: that the layer underneath every sub-national figure is the same layer, built the same way, every cycle. The moment that stops being true, cross-border consistency checks turn into forensic accounting instead of arithmetic. We built the consistent, annually-refreshed land-cover layer this piece keeps circling around because that forensic work shouldn't have to happen every reporting cycle just to find out whether a province gained or lost forest.
If your next cycle's provincial figures don't agree and you want to know whether that's real or an artifact of who built the mosaic, that's the question Habitat Loss Mapping is built to answer.