Field notes: the morning the minister asked why last year's number changed
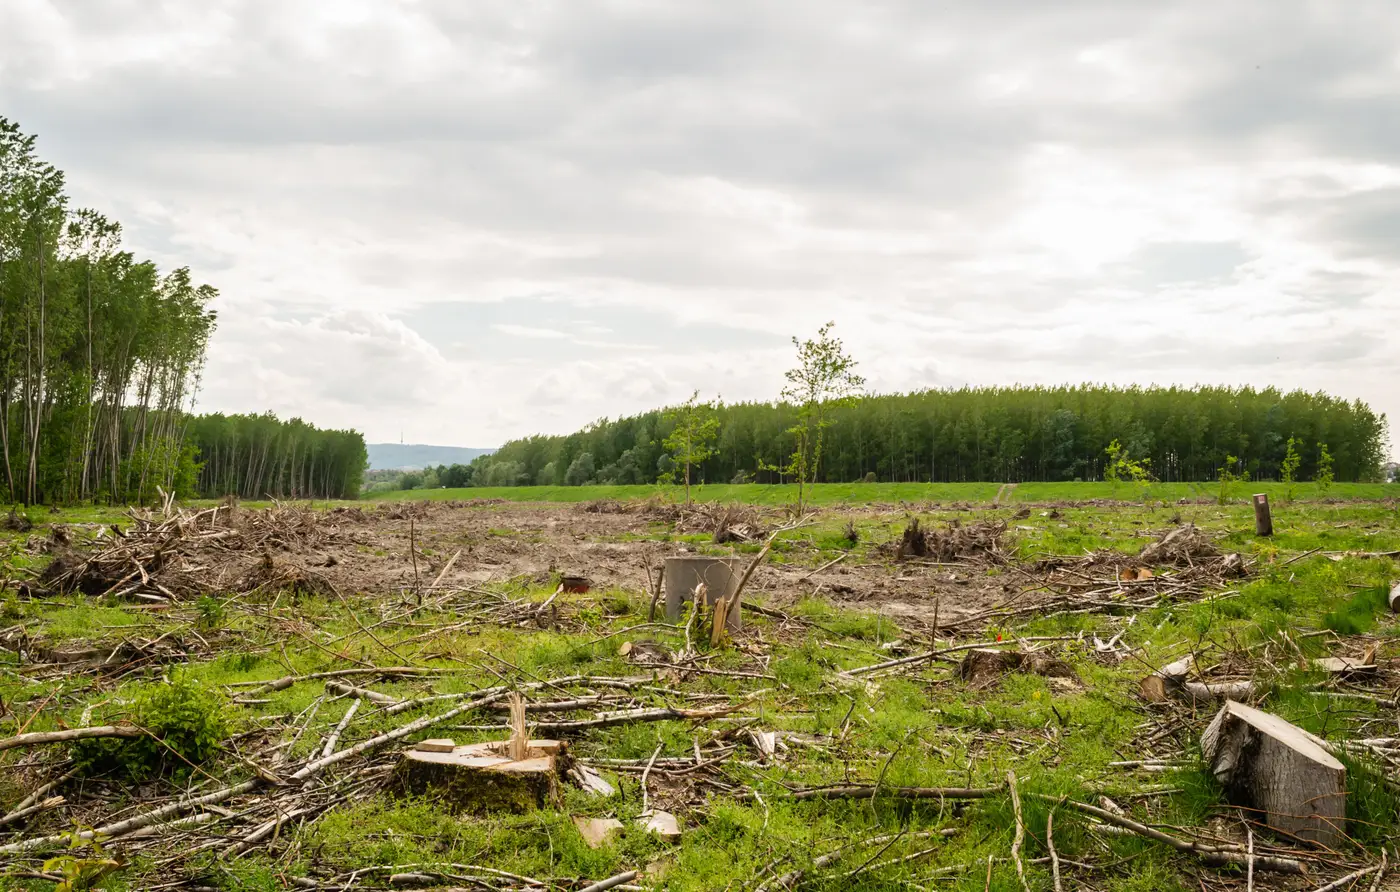
The briefing note was two pages. The meeting lasted four minutes. That's usually how it goes: you walk in with the figure, the minister nods, you walk out. This time the minister had last year's annex open next to this year's, side by side on the same screen, and the forest loss number for the northern districts had moved by almost a fifth. Not a dramatic swing by global standards. Enough to notice if you'd read both documents the night before, which, it turned out, someone had.
"Did we lose less forest than we thought, or did we lose more?" Fair question. I didn't have a fair answer ready, because the honest answer wasn't about forest at all. It was about who ran the classification.
Last year's figure came out of a contractor engagement commissioned the cycle before, built on a particular imagery batch, a particular training set, a particular analyst's judgment calls about what counted as degraded versus cleared. This year's figure came from a different firm, a different tender, a different season of scenes, because the budget line for "land-cover change study" gets re-competed and the lowest compliant bid doesn't always come from the same shop twice. Nobody did anything wrong, and nobody cut a corner. Two reasonable people, working from two reasonable but different definitions of a tree-cover threshold, will produce two reasonable but different numbers for the same hectares. That gap was pure methodology, sitting in my annex and looking exactly like forest loss.
I've sat in enough of these meetings now to know the damage isn't really the four minutes. It's what happens after. A revised figure, with no footnote explaining why it moved, reads to anyone outside the technical team as either a data quality problem or, worse, as someone having fiddled the books between cycles. For SDG 15.1.1 reporting that's a bad place to be, because your figures are getting pulled into a dashboard that sits next to other countries' figures, and the one thing a reviewer at the regional desk will flag before anything else is a series that jumps around for no stated reason. You can defend a bad trend. It's much harder to defend an unexplained one.
What actually fixed it, eventually, was going back and reprocessing the two years under one consistent set of rules, so the comparison was clean. Then I could say in the next annex: here is what changed on the ground, and here is what changed because we switched methods, and we will not make that switch again. That second clause mattered more than the first. A minister who's been burned once by an unexplained revision starts reading every subsequent figure with suspicion, and that suspicion costs you more meeting time than the original four minutes ever did.
The structural fix is less interesting to explain in a meeting, but it's the one that holds: stop re-tendering the classification from scratch every reporting cycle and instead run one method, continuously, so this year's number and last year's number come from the same lineage. That's the whole case for a standing national land-cover change layer rather than a fresh commissioned study each time. The figure can still move year to year, because land cover genuinely moves, but it moves for one reason instead of two tangled together, and you can say so in a sentence instead of a footnote nobody reads until it's too late.
I still keep both annexes from that cycle in a folder on my own desk, away from the shared drive, as a reminder of what a number costs you the first time it can't explain itself.
If your SDG figures keep needing that kind of explaining, Habitat Loss Mapping is built to stop the comparison from breaking in the first place.